Excel PivotTables: Advanced PivotTable Techniques for Analyzing and Presenting Data Faster
Self-paced course
Price
Rating
Overview
Master PivotTables in Excel to get better at analyzing and presenting data!
As a data analyst, you’re likely tasked with making sense of large data sets, leaving little time to summarize it into reports and dashboards. Join me as I share my advanced PivotTable techniques to make your data more interactive, enabling you to more quickly glean trends and insights from your data.
What you'll learn
- Create and set up PivotTables in order to better visualize your data
- Filter, sort, and slice your data within a PivotTable
- Add calculated fields to your PivotTables
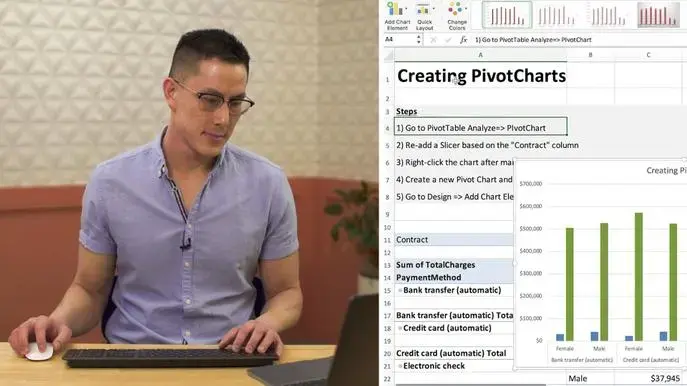
- Create PivotCharts to better visualize your data
- Create and save PivotChart templates to match brand guidelines
- Use GetPivotData for custom reports to get data and apply custom formatting
- Refresh PivotTable with Macros to automatically update different layouts and views of your PivotTables
Whether you're looking to become more efficient and proficient in Excel or other data analysis platforms, this class will allow you to more quickly understand and present data. You'll be actively using the Excel workbook I created for this class (see Projects & Resources).
Who is this class for?
Intermediate to advanced data analysts, but all students are encouraged to participate and enjoy.
Prerequisites
This class moves fast. You should have a basic understanding of Excel including:
- Navigating around Excel
- Writing basic formulas (including VLOOKUP)
- Creating basic charts
Some classes to consider taking as a prerequisite:
Software
I’ll be using Mac Excel 2016 for Office 365. You can use any of the following versions of Excel for this class:
- Windows: Excel 2019, Excel 2016, Excel 2013
- Mac: Excel 2016, Excel 2011
Similar courses
Featured articles
1790 students
English
Intermediate, Advanced


