
Spreadsheet And Excel : The Ultimate Guide

Self-paced course
Price
Rating
Overview
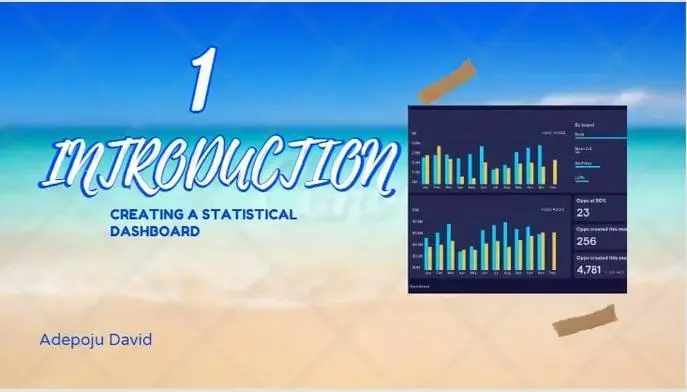
This is a Condensed course that will teach you all you need to know about how to get started and get going with Excel and Spreadsheet for Data analysis.
This course is made for anyone who wants to learn the art of data analysis and data visualization. We will begin by exploring the basic interface of Excel and Spreadsheet then move on to formatting our data and table in Spreadsheet and Excel after which we will learn how to do Data analysis in this software and use various functions, after all of this we will move on to create visualisations in these software and learn a lot more additional features. This course should prepare you to utilize Excel and Google Sheets to do your next analysis with confidence. You will be able to proudly showcase your skills to the world and add it to your resume.
==================================================
You will receive the following benefits as a result of taking this course:
-
Full free lifetime access to all the lecture videos
-
More than 2.5 hours of content with extra bonus videos.
-
All subsequent upgrades and supplementary lectures will always be free.
-
This course is made using the latest versions of Excel and Google Sheets so it will be great for any future version.
-
Confidently add your skills to your resume
Why this Course:
-
I have tried to create the video and explain it in view short and crisp manner.
-
The course structure is such a way that you go through Excel and Google Sheets and understand all concepts in the most structured way.
-
The course is segmented into various sections to help the student’s individual section in-depth and in a step-by-step manner.
-
The course has used learn by doing method which is best for software like Excel and Google Sheets.
With ZERO prior experience, you may begin your journey to becoming experienced in Excel and Google Sheets!
Looking forward to seeing you on the other side with me in your Data Analysis journey.
Similar courses


Featured articles

99 students
English
Beginner


